 Image source and description
Topic image:Wiradjuri Country–Hay. Photo credit: Victoria Seeck/EPA (2021)Banner image:Topic image sits above Butjin Wanggal Dilly Bag Dance by Worimi artist Gerard Black. It uses symbolism to display an interconnected web and represents the interconnectedness between people and the environment.
Image source and description
Topic image:Wiradjuri Country–Hay. Photo credit: Victoria Seeck/EPA (2021)Banner image:Topic image sits above Butjin Wanggal Dilly Bag Dance by Worimi artist Gerard Black. It uses symbolism to display an interconnected web and represents the interconnectedness between people and the environment.

Climate change
NSW will be warmer, the sea surface warmer and sea levels higher owing to climate change.
Topic report card
Read a two-page summary of the Climate change topic (PDF 360KB).

Overview
Human-induced climate change is a global issue.
Climate change is caused by emissions of carbon dioxide (CO2) and other greenhouse gases from the burning of fossil fuels (coal, oil and gas), and other human activity, including changes in land use.
These gases trap heat in the earth’s atmosphere, leading to increases in global average temperatures. Globally, 2023 was the hottest year on record since 1900 ().
The effects of climate change are already being experienced in NSW, and some extremes are expected to increase in frequency, intensity or duration in the future.
Urgent action is required to reduce greenhouse gas emissions and to adapt to a changing climate, thereby reducing detrimental impacts on ecosystems, human health, infrastructure and livelihoods.
Aboriginal peoples, as the oldest living cultures on earth, have adapted and thrived through changing climates. They hold intergenerational knowledge of climate resilience, including stories and knowledges from deep time ().
Temperature is increasing
Average global temperatures in 2014–23 have already risen by a range of 1.06–1.30°C above pre-industrial levels (1850–1900) (). The increase is projected to exceed 2.2–3.5°C by the end of this century if further action is not taken to limit greenhouse gas emissions ().
Global temperatures have historically fluctuated, but even small shifts can significantly affect our climate. A change of 2°C is likely to cause major disruptions and mass extinctions ().
The average surface temperature over land in NSW has risen by about 1.4°C since 1910 (). This value is not directly comparable to average global warming, which includes surface air temperatures over both land and ocean. Surface warming occurs faster over land than the ocean.
This increase in NSW temperatures has implications for ecosystems, infrastructures, livelihoods and the economy.
Climate change is also contributing to increasing frequency, intensity and duration of ‘hot days’ and the risk of heatwaves. Heatwaves occur when three or more consecutive days reach temperatures considered ‘hot’ for that location, based on observed temperatures over a preceding period ().
See the topic for more information.
Average winter rainfall may decrease in some parts of NSW
Significant uncertainty remains in relation to rainfall projections. Several climate drivers contribute to the State's seasonal rainfall. Seasonal variations driven by these climate drivers, including El Niño and La Niña, mean that clear trends can be more difficult to establish by using historical rainfall data.
El Niño and La Niña are naturally occurring climate phenomena originating from the Pacific Ocean that have a substantial influence on Australian and global weather patterns. These phases affect ocean temperatures, winds, surface air pressures and rainfall.
Sometimes we experience a warmer weather with less rain (El Niño), and sometimes we experience a cooler weather with more rain (La Niña). More than half of the time, we experience normal weather (neutral climate phase).
Together these weather phases are called the El Niño Southern Oscillation (ENSO).
Projections suggest that coastal regions of NSW may experience significant reductions in rainfall in winter ().
Sea level is rising
Climate change is causing sea levels to rise.
As global temperatures rise, ice sheets and glaciers in Greenland and Antarctica are melting. Combined with the thermal expansion of water (water expands as it warms), this is causing sea levels to rise ().
The rate of global sea level rise has significantly increased since 1901 (). They are now rising at three times the rate in the early to mid-1900s. Increases in the past 100 years have been:
- 0.13 centimetres (cm) per year between 1901 and 1971 (71 years)
- 0.19cm per year between 1971 and 2006 (35 years)
- 0.37cm per year between 2006 and 2018 (13 years) ().
In NSW, sea level rose 12cm just between 1991 and 2023 ().
Projections suggest that sea levels are likely to rise by more than 100cm (1 metre) by the end of the 21st century (), resulting in coastal erosion, coastal flooding, saltwater intrusion and infrastructure damage.
There is uncertainty over the response of marine-based ice sheets to future warming, meaning sea level rise could be considerably higher ().
Sea surface temperature is increasing
The waters near NSW underwent the highest warming in the Australian region since the 1970s ().
Globally, oceans absorb more than 90% of the extra heat trapped by the high concentrations of greenhouse gases in the atmosphere (). Near-surface sea temperature near Sydney increased by 0.14–0.2°C per decade since the 1950s.
Changing sea surface temperatures will lead to changing weather patterns over NSW.
Impacts on oceans
Ocean warming is leading to more frequent and intense marine heatwaves (), such as the unprecedented marine heatwave during the summer of 2015–16 (; ).
It exposes ocean ecosystems, plants and animals to temperatures they are not adapted to, which means they may not survive in NSW waters.
Ocean ecosystems are also affected by ocean acidification that occurs when seawater absorbs more carbon dioxide from the atmosphere. The levels of carbon dioxide in the atmosphere are rising owing to increasing emissions from human activities ().
This particularly affects marine shell-building organisms, such as sea urchins, corals and phytoplankton ().
See the topic for more information about ocean temperatures and acidification.
Assessing and modelling
Assessing climate change is essential for driving action to reduce the impacts of climate change.
Intergovernmental Panel on Climate Change
At the global level, climate change is assessed by the Intergovernmental Panel on Climate Change (IPCC). Its Sixth Assessment Report () highlights key findings, including:
- the clear human influence on global warming
- projections indicating likely warming 2.2–3.5°C by 2100
- a greater intensity of multiple hazards with each increment of global warming.
NSW and Australian Regional Climate Modelling project (NARCliM)
The NSW Department of Climate Change, Energy, the Environment and Water (NSW DCCEEW) has developed the NSW and Australian Regional Climate Modelling project (NARCliM) to project future climate changes in NSW, south-east Australia and parts of Australasia (; ).
Using different scenarios of global greenhouse gas emissions, NARCLiM helps inform evidence-based actions for adaptation to climate change.
See Scenarios used in modelling climate projects for more information on these scenarios.
This report relies on the newest NARCliM data (NARCliM2.0) for insights on future temperature and rainfall in NSW. Further information and resources are available via the AdaptNSW website. NARCliM projections can be explored using an interactive climate change map or downloaded from NSW Climate Data Portal.
Climdex
Climdex is a joint project between the University of NSW and the Australian Research Council’s Centre of Excellence for Climate Extremes. Climdex indices are used to understand how temperature and rainfall extremes change among times and places.
Suitable for advanced users, datasets from different locations can be downloaded at Climdex.
Impacts
Climate change is already affecting NSW communities.
Impacts to human health, the environment, water resources, the economy, properties and infrastructure will continue to increase.
- Human health impacts include respiratory and cardiovascular problems, as well as mental health concerns () due to warmer temperatures and poorer air quality from dust particles, bushfire smoke and storm activity.
- Environmental impacts include increasing temperatures and changes to rainfall patterns in some locations occurring too fast for plants and animals to adapt (), warming ocean temperatures forcing organisms to move further south () and ocean acidification reducing the ability of some organisms to form shells ().
- Water resource impacts include water scarcity in some places due to changes in rainfall patterns in some locations and seasons ().
- Economic impacts include declining crop yields () and damage to critical infrastructure.
- Coastal erosion and property losses will increase with rises in sea levels and sea surface temperatures ().
Find out how climate change may affect your community.
The current impacts of climate change on Country and Aboriginal cultural values, health and livelihoods are significant because they have occurred so rapidly, and in conjunction with colonisation, compromising the ability of communities to adapt.
Responding to the changing climate
Managing climate risks will help to reduce the impacts of climate change.
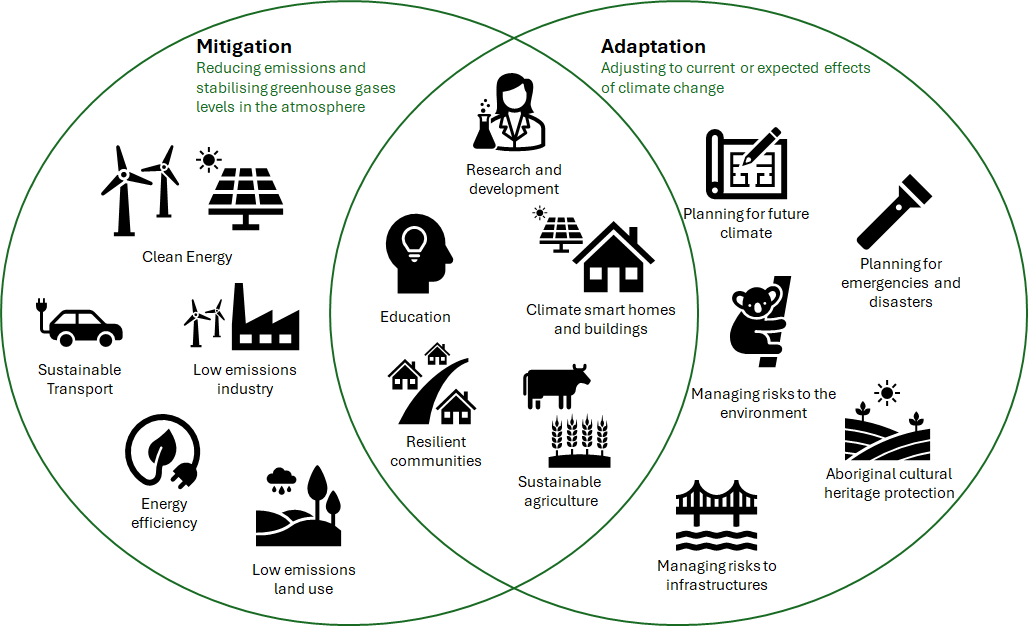
Effective management strategies must include actions for both mitigation and adaptation (see Image C1.1).
Mitigation means actions to reduce greenhouse gas emissions or removing greenhouse gases from the atmosphere to reduce the rate of climate change.
Adaptation means adjusting to the actual or expected effects of changing climate.
Image C1.1: Examples of climate change mitigation and adaptation actions and complementary approaches
Aboriginal knowledges can provide crucial insights into adapting to current and future changes driven by rapid and human-induced climate change ().
While there is an increasing recognition of the need to listen to and incorporate Aboriginal perspectives, a gap remains between intent and implementation ().
The NSW Climate Change (Net Zero Future) Act 2023 sets emission reduction targets and an objective for the state to become more resilient to a changing climate. The Act also establishes an independent body, the Net Zero Commission, to monitor progress towards these objectives and targets.
One of the guiding principles of the Act states that action to address climate change should take into account the knowledge and perspectives of Aboriginal communities and the need to support Aboriginal communities who may be affected by the action.
See the and topics for more information about climate change mitigation.
Climate change creates risks and opportunities for almost all areas of society, the environment and the economy. This means climate change adaptation is an issue that cuts across every portfolio in the NSW Government.
Table C1.1 lists current key legislation, policies and guidelines related to climate change and adaptation in NSW. It is not an exhaustive list because adaptation is a far reaching and complex issue. These are intended to help NSW to anticipate the harmful effects of climate change and develop ways to lessen exposure and vulnerability.
Table C1.1: Current key legislation, policies and guidelines to adapt to climate change in NSW
| Legislation, policy or guideline | Summary |
|---|---|
| Climate Change (Net Zero Future) Act 2023 | The main features of the Act are:
|
| Coastal Management Act 2016 | Establishes the coastal zone and objectives to manage the use and development of the coastal environment in an ecologically sustainable way. Includes reforms to consider climate change impacts and responses in coastal planning. The reforms resulted in a new coastal management manual and State Environmental Planning Policy (Coastal Management) 2018. |
| NSW Reconstruction Authority Act 2022 | Promotes community resilience to the impact of disasters in NSW through disaster prevention, preparedness and adaptation, and recovery and reconstruction following disasters. This Act also establishes the NSW Reconstruction Authority. |
| Climate Risk Ready NSW Guide | Includes a suite of tools that can help government agencies to identify and manage climate risks. |
| Disaster Adaptation Plans | Outline projects, strategies or actions to mitigate or minimise the impact of disasters caused by natural hazards at a local level. These plans are aligned to the State Disaster Mitigation Plan. |
| EPA’s Climate Change Policy and Climate Change Action Plan 2023–26 | Outline a comprehensive regulatory approach and set of actions to address the causes and consequences of climate change in NSW. They include actions to support licenced industries to decarbonise and build resilience to climate change. |
| NSW Climate Change Adaptation Strategy | Strengthens and expands the framework to adapt to climate change now and over the long term. |
| NSW Climate Change Adaptation Action Plan 2025–2029 | This whole-of-government plan includes 46 actions led by eight agencies that target known climate change impacts and risks and help work towards achieving the Climate Change (Net Zero Future) Act 2023 adaptation objective. The actions help create the knowledge, skills, resources and processes needed to enable further adaptation on a larger scale. The plan states that decisions on adaption in NSW should be planned and based on comprehensive analysis of the best available information, including Aboriginal knowledge systems. The strategy includes 'Enable Aboriginal adaptation' as a key criterion in establishing Adaptation Action Plans which will include actions co-designed with Aboriginal communities to promote social, economic and cultural wellbeing. |
| NSW Climate Change Fund | Provided funding between 2017 and 2022 for activities that reduce the impacts of climate change, including energy efficiency, clean energy, adaptation and resilience. |
| NSW Climate Change Policy Framework | Maximises the economic, social and environmental wellbeing of NSW in the context of a changing climate and of current and emerging international and national policy settings and actions to address climate change. It also defines the NSW Government's role in reducing carbon emissions and adapting to the impacts of climate change. |
| State Disaster Mitigation Plan | Designed to improve community resilience and better prepare NSW to face the challenges of disasters caused by natural hazards such as floods, bushfires, storms and cyclones, coastal erosion and inundation. |
Notes:
See the Responses section for more information about how is being addressed in NSW.
Related topics: | | | | | | | | |
Status and trends
Climate change indicators
The NSW Government monitors the annual mean near-surface temperature (2 metres above land), sea level rise and sea surface temperature in NSW (see Table C1.2).
This monitoring reflects the global nature of climate change and enables comparison of indicators between countries.
- Annual mean land temperature is increasing (getting worse). Projections show increasing temperatures under all emissions scenarios, with extreme consequences under a high-emissions scenario (see Temperature).
- Sea level rise is increasing (getting worse). Projections show that the rate of sea level rise should stabilise under a low-emissions scenario but could double under a high-emissions scenario if greenhouse gas emissions aren’t reduced (see Sea level rise).
- Sea surface temperature is increasing (getting worse). This indicator has been downgraded from ‘moderate’ to ‘poor’ as temperature has risen at the rate of 0.14–2°C per decade from 1953 to 2020 (see Sea surface temperature).
Owing to seasonal and geographic variability and uncertainty, rainfall in NSW is not used as an indicator. The current state and projections are discussed in the Rainfall section.
Table C1.2: Climate change indicators
| Indicator | Environmental status | Environmental trend | Information reliability |
|---|---|---|---|
| Annual mean land temperature | Getting worse | Good | |
| Sea level rise | Getting worse | Good | |
| Sea surface temperature | Getting worse | Good |
Notes:
*See the topic for status and trends relating to extreme rainfall, ‘hot days’ and severe fire weather.
Indicator table scales:
- Environmental status: Good, moderate, poor, unknown
- Environmental trend: Getting better, stable, getting worse
- Information reliability: Good, reasonable, limited.
See to learn how terms and symbols are defined.
Looking forward with the NSW and Australian Regional Climate Modelling project (NARCliM)
There is conclusive evidence that the climate is changing. The extent of climate change depends on future levels of global greenhouse gas emissions ().
To better understand the extent of climate change we may face, the NSW Government uses the NARCliM regional climate model.
NARCliM1.0 was released in 2014, focusing on NSW, the ACT and parts of Australasia. NARCliM2.0 was released in 2024, incorporating new data on global emissions and climate change, providing higher resolution of results and delivering technical improvements.
NARCliM2.0 downscales global climate models to the Australian region to project regional impacts of climate change under future greenhouse gas emissions scenarios.
These scenarios are known as the Shared Socioeconomic Pathways – Representative Concentration Pathways (SSP-RCPs) (). They describe how the world may develop under different types of energy generation, rates of population growth, economic development and land uses. These lead to different levels of greenhouse gas emissions over time.
See Scenarios used in modelling climate projects.
This chapter refers to two scenarios:
- SSP1–2.6 – a low-emissions scenario where global CO2 emissions are cut to net zero by about 2075 and estimated global warming is 1.3–2.4°C by 2081–2100
- SSP3–7.0 – a high-emissions scenario where global CO2 emissions are projected to double by 2100 and estimated global warming is 2.8–4.6°C by 2081–2100.
Some indicators, including temperature and rainfall, are affected by variability of drivers such as ENSO and the Indian Ocean Dipole ().
- NARCLiM2.0 is one of several datasets that project future climate. It is unique in currently being the first regional climate modelling in Australia to simulate a very high resolution of 4 kilometres, which helps simulate events associated with convection like storms.
- Uncertainty remains in climate change estimations under all climate model projections, including NARCliM2.0.
- NSW is a large state with diverse topography; these factors significantly influence its climate and weather.
Projections for future sea level rise and sea surface temperature are not within the current scope of NARCliM2.0.
See Scenarios used in modelling climate projects for more information on shared socioeconomic pathways.
Scenarios used in modelling climate projections
The Intergovernmental Panel on Climate Change (IPCC) was created by the United Nations to assess the science of climate change, the science of impacts and adaptation, and the state of knowledge of mitigation. In 2021, IPCC released its Sixth Assessment Report, which adopts a set of future global climate scenarios called the Shared Socioeconomic Pathways (SSPs) combined with Representative Concentration Pathways (RCPs), or the SSP-RCPs ().
The SSPs are five baseline narrative scenarios (SSP1 to SSP5) based on socioeconomic, geopolitical and technological trends.
SSP1 (Sustainability – Taking the Green Road): The most optimistic scenario, which entails great global strides in sustainable development.
SSP2 (Middle of the Road): The next best scenario, where countries work more slowly towards sustainability.
SSP3 (Regional Rivalry – A Rocky Road): Socioeconomic trends follow historical trends, with slow progress towards sustainability.
SSP4 (Inequality – A Road Divided): Conflicts cause countries to prioritise national or regional concerns.
SSP5 (Fossil-Fuelled Development): There is rapid global economic growth but at the cost of massive use of fossil fuels.
The RCPs are greenhouse gas emissions scenarios that were initially adopted in IPCC’s Fifth Assessment Report in 2014. Scenarios differ according to the potential level of ‘radiative forcing’ in watts per square metre (W/m2) in 2100. Higher radiative forcing means greater amounts of heat energy available to warm our climate.
The Sixth Amendment Report uses the following SSP-RCP scenarios (labelled as SSPx-y, where x is the SSP baseline number and y is the RCP level). The very likely range of warming in 2081–2100 relative to the average global temperature in 1850–1900 is presented here. The bold scenarios are those used in this report.
- SSP1–1.9 (very low-emissions with very likely warming of 1.0–1.8°C)
- SSP1–2.6 (low-emissions with very likely warming of 1.3–2.4°C)
- SSP2–4.5 (intermediate emissions with very likely warming of 1–3.5°C)
- SSP3–7.0 (high-emissions with very likely warming of 2.8–4.6°)
- SSP5–8.5 (very high-emissions with very likely warming of 3.3–5.7°C)
This topic uses NARCliM2.0 modelling under the low- (SSP1–2.6) and high- (SSP3–7.0) emissions scenarios, as these capture a broad range of plausible future climates we may experience.
NARCliM2.0 modelling under the ‘middle of the road’ SSP2–4.5 scenario will be released in 2025.
The projections of the IPCC’s Sea Level Projections Tool () under all scenarios (SSP1–1.9 to SSP5–8) were used to model potential sea level rise on the east coast of NSW.
Source:
Temperature
NSW temperature has been increasing
Temperatures have been increasing in NSW since 1910, when national records began, and are projected to continue to increase under both low- and high-emissions scenarios ().
The annual mean surface temperature over land in NSW has increased by 1.4°C compared to 1910 levels (). Meanwhile, Australian warming averaged 1.51 ± 0.23°C in the same period ().
Considerable year-to-year variability in temperatures associated with the ENSO and other climate drivers is evident across NSW. This means that while the past two decades have been Australia’s warmest so far, cooler years do occur. La Niña years are commonly associated with cooler-than-average temperatures in NSW.
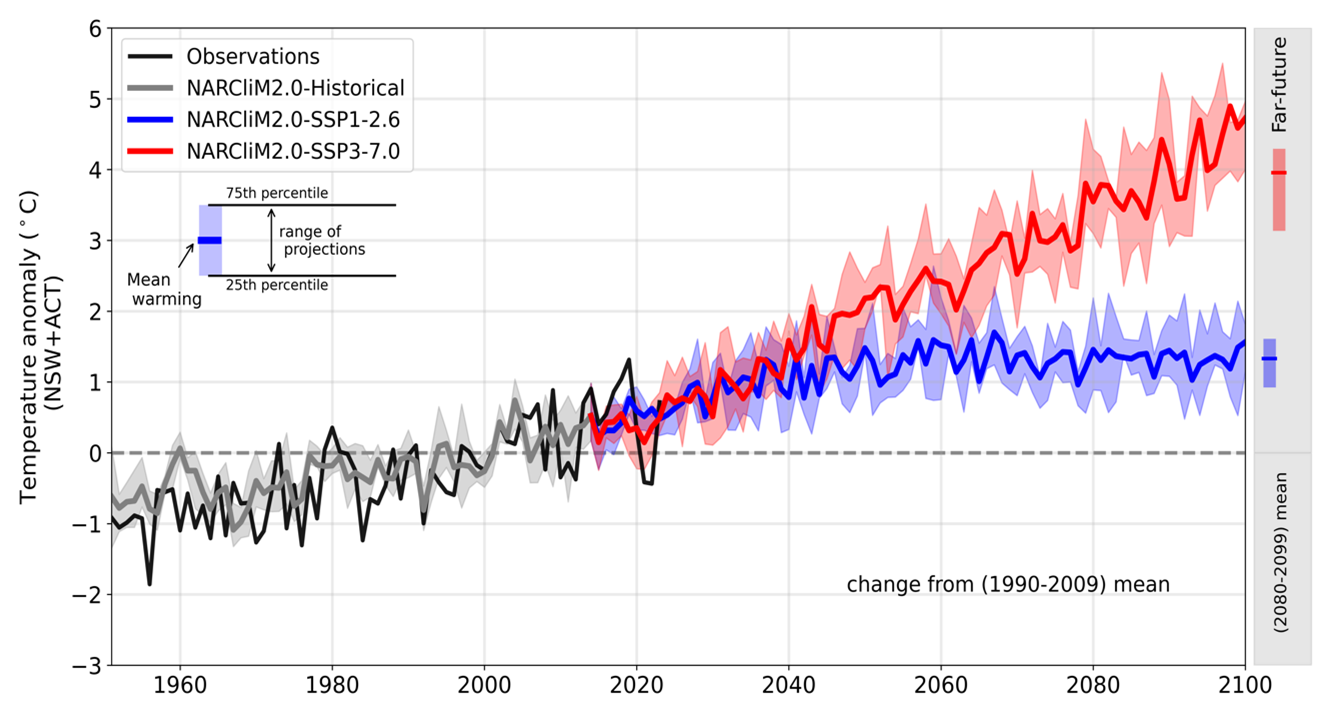
Within the year-to-year fluctuations, there is clearly an upward trend in temperature changes in NSW (see Figure C1.1). Changes or ‘anomalies’ in land surface temperature are expressed as deviations from a baseline average temperature. A positive value means that the observed temperature is warmer than the baseline and a negative value means that it is cooler.
Figure C1.1: Historical and projected average temperature changes in NSW
Notes:
Temperature anomalies or change in temperature compared to the historical baseline (1990–2009) temperature.
The solid black line represents observed historical temperature change (recorded differences in temperature).
The grey line represents the modelled historical temperature anomalies.
The black line represents the observed temperature anomalies.
The red line represents the average of NARCliM2.0 high-emissions climate projections.
The blue line represents the average of NARCliM2.0 low-emissions climate projections.
The shading around each of the solid lines represents the model ranges (from 25th to 27th percentile).
Temperatures will continue to increase
Temperatures in NSW are projected to keep increasing. The increase will be exacerbated if global greenhouse gas emissions are not reduced to net zero. NARCliM2.0 projections have high model agreement under both low- and high-emissions scenarios that show an increase in NSW temperatures (see Figure C1.1).
Under a high-emissions scenario (red line in Figure C1.1), the estimated average warming by 2080–90 will be 4°C relative to 1990–2009, nearly three times the 1.3°C warming under lower emissions scenario (blue line).
Where will temperatures increase?
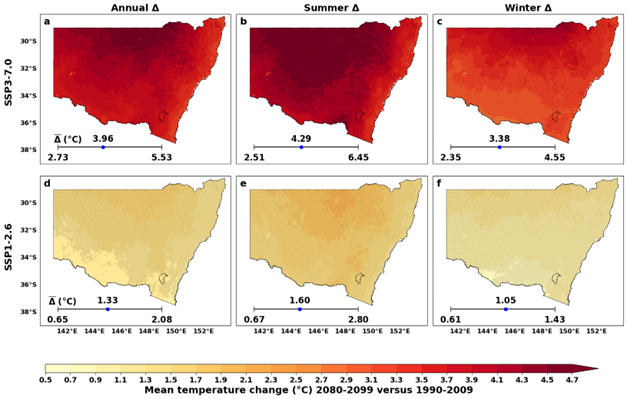
Temperatures in NSW will increase under both low- and high-emissions scenarios (see Figure C1.2).
The maps in Figure C1.2 show higher warming in the semi-arid inland and northern NSW regions than along the coast.
Under the high-emissions scenario (SSP3–7.0) by 2080–99:
- Significantly higher temperature increases under this scenario relative to under SSP1-2.6.
- Annual (Figure C1.2, map a): Increase of about 4°C and up to 4.7°C in the north of the State (dark red area).
- Summer (map b): Increase of about 4.3°C and up to 4.9°C in the north and inland of the State (dark red area).
- Winter (map c): Increase of about 3.4°C and up to 4.1°C in the north of the State.
Under the low-emissions scenario (SSP1–2.6) by 2080–99:
- Annual (map d): Increase of about 1.3°C and up to 1.6°C in the north of the State.
- Summer (map e): Increase of about 1.6°C and up to 2°C in the north of the State.
- Winter (map f): Increase of about 1°C and up to 1.3°C in the north of the State.
The projected warming across the State is more pronounced in summer than in winter and is greatest in summer under the high-emissions scenario (map b).
Temperature changes are presented as a range of values (Figure C1.2, bottom left corner of each map). This reflects the uncertainty in the exact degree of change.
All temperature changes are consistently positive values, which indicates confidence that temperatures will increase under all emissions scenarios.
See the Interactive climate change projections map for in-depth exploration of NARCliM2.0 data data including projections for various regions and time periods (eg, 2030–2049, 2040–59 and others).
Figure C1.2: Projected changes (∆, difference between 2080–99 and 1990–2009) in mean near-surface air temperature
Notes:
NARCliM2.0 modelled mean near-surface temperature increases in 2080–99 under SSP3–7.0 (maps a, b, c) and SSP1–2.6 (maps d, e, f). Annual (maps a & d), summer (maps b & e) and winter (maps c & f) projections are presented.
The average change (∆) from all the models comprising NARCliM2.0 are shown at the bottom left of each plot, along with the range of changes from the individual models.
The stippling (small dots) shows locations where projected changes are statistically significant.
The Mann–Whitney U test (α = 0.05) is used to test the statistical significance.
Temperature changes are calculated from historical baseline (1990–2009).
Rainfall
Complexities in the weather systems that generate rain mean there is some uncertainty around rainfall projections ().
Figure C1.3 shows the interannual variability in average historical rainfall in NSW. Rainfall patterns in NSW have historically been variable (see Figure C1.3), because they are strongly influenced by a combination of local conditions, seasonal variability and large-scale climate drivers, including ENSO, the Indian Ocean Dipole and the Southern Annular Mode (; ).
The bars in Figure C1.3 show the interannual variability in average historical rainfall in NSW, which is due to factors such as large-scale climate drivers and variability across seasons and regions.
Figure C1.3: Average annual rainfall in NSW, 1990–2023
Notes:
The bars represent the average annual rainfall across NSW for the years shown. The red line represents the 11-year rolling average.
The green horizontal line represents the long-term average from 1900–2023.
There is uncertainty around rainfall projections generated by all global and regional climate models.
Modelling rainfall can be more challenging than modelling temperature due to the complexities of the weather systems that generate rain and substantial interannual variability in rainfall patterns across NSW.
NARCliM projections capture a range of plausible climate futures under the different emissions scenarios, including wet and dry outcomes. This means that rainfall is inherently more variable and uncertain in the NARCliM projections than temperature, and the full range of rainfall projections should be taken into account.
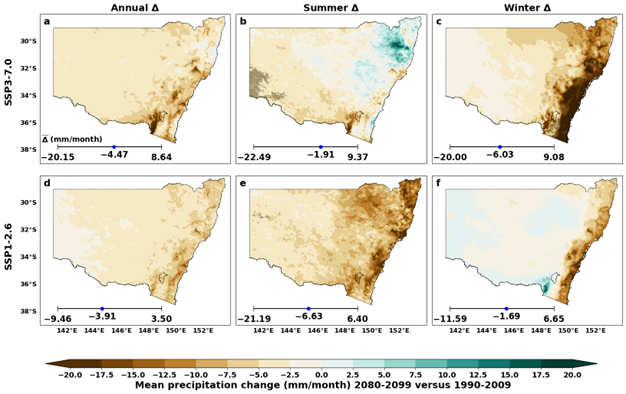
NARCliM2.0 projections indicate that NSW is likely to experience varied changes in mean precipitation patterns across the different emissions scenarios and each season and location (see Figure C1.4).
These changes highlight the importance of considering both spatial and seasonal variations when planning climate adaptation strategies in NSW.
The NARCliM2.0 mean precipitation projections suggest that NSW may experience changes in precipitation patterns by 2080–99, with overall reductions in annual, summer and winter precipitation under both low- and high-emissions scenarios.
The magnitude of annual and winter changes is greater under a high-emissions scenario versus the low-emissions scenario, reflecting the implications of higher greenhouse gas concentrations for average precipitation patterns.
Summer reductions are generally larger in magnitude under the low-emissions scenario.
Under the high-emissions scenario (SSP3–7.0) by 2080–99:
- Significant decrease in winter precipitation in southern and coastal areas.
- Annual (Figure C1.4, map a): An overall decrease of about 4.5 millimetres (mm) per month, this is geographically variable and greatest in eastern NSW (brown areas).
- Summer (map b): An overall decrease of about 2mm per month, this is geographically variable and increases in north-eastern NSW (teal-blue areas).
- Winter (map c): An overall decrease of about 6mm per month, notably in coastal NSW (dark brown areas).
Under the low-emissions scenario (SSP1–2.6) by 2080–99:
- Annual (map d): An overall decrease of about 3.9mm per month, greatest in eastern NSW (brown areas).
- Summer (map e): An overall decrease of about 6.6mm per month, with larger decreases over the eastern areas of the State (dark brown areas).
- Winter (map f): An overall decrease of about 1.7mm per month, notably in coastal NSW (dark brown areas), but increases in other parts of NSW (blue areas).
These projections suggest that some regions such as north-eastern NSW may see an increase in summer rainfall, whereas southern coastal NSW may see a reduction in winter rainfall.
Nonetheless, the wide range of values ranging from negative to positive (see Figure C1.4, bottom left corner of each map) indicate that there is a high level of uncertainty in these projections. Further research is required to understand uncertainties in modelling results.
Most of NSW will not see a significant change in precipitation on the basis of these projections.
See the Interactive climate change projections map for in-depth exploration of NARCliM2.0 data.
Figure C1.4: Projected changes (∆, difference between 2080–99 and 1990–2009) in mean precipitation
Notes:
NARCliM2.0 modelled changes in mean precipitation in 2080–99 under SSP3–7.0 (maps a, b, c) and SSP1–2.6 (maps d, e, f). Annual (maps a & d), summer (maps b & e) and winter (maps c & f) projections are presented.
The average change (∆) from all the models comprising NARCliM2.0 are shown at the bottom left of each plot, along with the range of changes from the individual models.
The stippling (small dots) shows locations where projected changes are statistically significant.
The Mann–Whitney U test (α = 0.05) is used to test the statistical significance.
Sea level rise
Already rising sea levels are projected to continue to rise ().
The sea level rise along the NSW coastline is monitored at the Baseline Sea Level Monitoring Station in Port Kembla (Wollongong).
From July 1991 to December 2023, the sea level at Port Kembla increased by about 3.7mm per year (), with a total increase of about 12cm since 1991 (see Figure C1.5).
The increase is large enough that we are beginning to see the impacts of continual sea level rise on many coastal communities, particularly during storm surges and high tides.
Figure C1.5: Measured historical annual mean sea level at the Port Kembla Baseline Sea Level Monitoring Station, 1991–2023
Notes:
The 1991 data include only part of the year following the site upgrade as part of the Australian Baseline Sea Level Monitoring Project.
Lowest Astronomic Tide (LAT) units are adjusted to Australian Height Datum (AHD) units.
The rate of this rise could accelerate if global greenhouse gas levels in the atmosphere remain high.
Sea level along the NSW coast is projected to continue rising under all emissions scenarios. At Port Kembla, sea level is projected to rise by 11–24cm under the SSP1-2.6 emissions scenario and by 16–28cm under the SSP3-7.0 by 2050 relative to a baseline period of 1995–2014.
Later in the century, sea level rise is projected to accelerate under both emissions scenarios, with significantly faster acceleration under the SSP3-7.0 scenario. Sea-level rise by 2100 is projected to be 24–56cm under the SSP1-2.6 emissions scenario and 50–91cm under the SSP3-7 scenario. Even greater sea-level rise will occur by 2150, with a projected rise of 33–93cm under a low-emissions scenario and 84–165cm under a SSP3-7.0 emissions scenario.
Projected sea levels at Port Kembla under different emissions scenarios are shown in Figure C1.6. The scenarios used here are based on the SSP-RCP storylines from the IPCC’s Sixth Assessment Report (explained in Scenarios used in modelling climate projects).
Modelling projects that the sea level at Port Kembla could rise by about 58cm by 2150 if global net zero emissions were achieved in 2075 (SSP1–2.6, low-emissions scenario) and about 120cm if emissions were to double by 2100 (SSP3–7.0, high-emissions scenario).
See the interactive IPCC 6th Assessment Report Sea Level Projections for more information.
Figure C1.6: Projected mean sea level rise at Port Kembla using IPCC AR6 modelling (SSP-RCP) for different greenhouse gas emission levels
Notes:
The plot shows measured and projected sea level rise at Port Kembla.
The solid black line represents historically measured values from 1990 to 2023, including annual observations from the Port Kembla Seaframe tide gauge.
The other solid lines represent the median (or 50th percentile) projections for the low- (SSP1–2.6) and high- (SSP3–7.0) emissions scenarios.
The dotted lines show the 5th to 95th percentile ranges for SSP1–2.6 and SSP3–7.0.
Projections are relative to a 1995–2014 baseline.
Sea surface temperature
Sea surface temperature along and near the NSW coastline is increasing.
It is important to track sea surface temperature, as it affects marine ecosystems as well as NSW industries, such as fisheries and aquacultures.
The annual sea surface temperature in the Tasman Sea has increased since 1997 relative to the baseline average annual temperature in 1961–90 (see Figure C1.7).
Figure C1.7: Annual sea surface temperature change in the Tasman Sea, 1900–2023
Notes:
The change in annual sea surface temperature was calculated from a 30-year baseline (1961–90).
Data comes from the Bureau of Meteorology (BOM), which used the National Oceanic and Atmospheric Administration’s Extended Reconstructed Sea Surface Temperature version 5 (NOAA ERSST V5).
Near-surface ocean temperature at Port Hacking (Sydney) increased at an average rate of about 0.14–0.2°C per decade from 1953 to 2022 ().
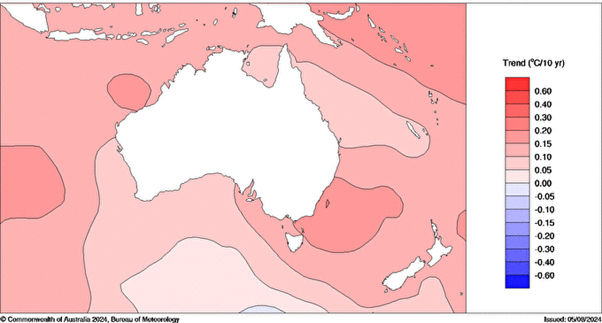
Waters off south-east Australia experienced the greatest warming in the Australian region since the 1970s () (see Map C1.1).
The East Australian Current now extends further south, causing the Tasman Sea to warm at twice the global average rate (). As a result, off the coast of NSW the southern half of the state has warmed at a rate twice that of the north, about 0.5°C per decade from 1992 to 2017 ().
Map C1.1: Trend in Australian region sea surface temperatures, 1970–2023
Pressures and impacts
Greenhouse gas emissions
Global greenhouse gas emissions from human sources continue to increase, although emissions are reducing in some countries (). Human activities include demand for housing, land, energy, water, food, consumer products and transport services.
As a result of these activities and of our growing population, we now generate more emissions than at any earlier time.
This growth has increased the level of greenhouse gases in our atmosphere to a point where the global temperature is increasing at an unprecedented rate. This is resulting in feedback loops, such as:
- climate change is leading to more warm days
- warmer days will lead to more use of air conditioners, which are powered by coal-fired power plants
- this generates more greenhouse gas emissions
- which will lead to increased temperatures
- resulting in increased use of air conditioning.
This means that the more energy we use derived from fossil fuel combustion, the more emissions we create and the more energy we therefore need to use.
Average global temperatures in 2014–23 have already risen by 1.06–1.30°C above pre-industrial levels (1850–1900) (). The increase is projected to exceed 2.2–3.5°C during this century without significant policy intervention ().
See the , , and topics for more information.
Changes in land use
Land use refers to the use and management of land resources, including the production of goods (food, timber, energy and raw materials) and services (housing, utilities and nature conservation) ().
Land and oceans act as carbon sinks by absorbing carbon from the atmosphere.
Land absorbs carbon through plants. Plants convert carbon dioxide (CO2) into carbohydrates through photosynthesis. The carbohydrates eventually accumulate in soil as the plants decay. About 31% of CO2 emissions have been absorbed into land from 2010 to 2019, helping to manage the level of CO2 in the atmosphere ().
See the topic for more information.
Land use can be a significant driver of climate change.
Globally, agriculture, forestry and other land uses accounted for 21% (11.9 gigatonnes) of annual carbon dioxide equivalent (CO2-e) emissions from 2010 to 2019 (). This means that, while land can be a carbon sink, globally, it emits more greenhouse gases than it absorbs.
In NSW, the agricultural sector accounted for 18% of the total greenhouse gas emissions in 2022 ().
The land use, land use change and forestry sector has acted as a carbon sink in NSW since 2007, reducing the State’s total emissions by 19% in 2022 ().
See the topic for more information.
Increased human activity due to population growth could result in increased demand for urbanisation, deforestation and intensive farming.
See the and topics for more information.
Human health impacts
Climate change is already affecting the health and wellbeing of communities (; ).
Impacts from climate change, such as warmer temperatures, poorer air quality and increased pollen production, can lead to health problems, such as respiratory and cardiovascular issues. Decreased rainfall can lead to poorer water quality or increases in blooms of blue-green algae ().
Heat-related deaths are predicted to double on average across major Australian cities from 2020 to 2050 (; ). It is estimated that declining air quality due to climate change will result in about 60 extra premature deaths per year in Sydney by 2050 (; ).
The correlation between heat and heat-related illness is evident through the direct relationship between maximum temperatures and heat-related presentations in hospital emergency departments in NSW (see Figure C1.8).
Figure C1.8: Heat-related presentations in hospital emergency departments in NSW from July 2014 to June 2023
Notes:
The blue line is the number of heat-related health presentations in emergency departments in NSW.
The orange line is the mean maximum temperature in NSW.
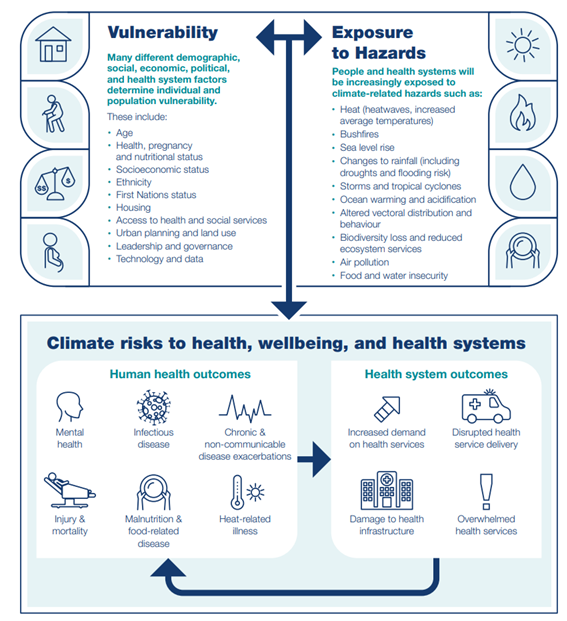
The most vulnerable groups (children, the elderly, people with pre-existing health conditions and people with low income) are unlikely to have the means to quickly adapt to the changing weather patterns associated with climate change. This could lead to adverse health impacts and place further strain on the health system (see Image C1.2).
Image C1.2: Climate-related risks to health and wellbeing
Heat also affects mental health, with increased instances of aggression and domestic violence, self-harm and suicide ().
‘Eco-distress’ or ‘eco-anxiety’ – the fear of environmental doom – can result in stress, worry, sleeplessness and despair ().
These concerns particularly affect young people and those with strong ties to a place.
Communities who have been affected by climate change have higher levels of concern about climate change (). This includes communities affected by the Black Summer bushfires or the severe flooding in 2022.
Impacts to Aboriginal cultural values
Climate change affects the ability of Aboriginal peoples to care for Country and practice culture ().
Increased frequency and intensity of extreme weather events causes damage to cultural sites and active landscapes. For example, coastal sites, such as shell middens and burial grounds, are being damaged by erosion, whilst catastrophic bushfires, like those in 2019–20, have caused extensive damage to cultural landscapes including cultural sites and important plants and animals.
Impacts to Country also impact the health and wellbeing of Aboriginal peoples
Severe flooding in NSW in 2022 displaced some Aboriginal communities and damaged Aboriginal-owned social and cultural assets.
Health impacts from climate change include increased vulnerability to impacted by vector-borne and water-borne diseases, heat stress and isolation during flooding ().
Rivers and wetlands, critical to Aboriginal cultures, are threatened by rainfall decreases and unsustainable water extraction, reducing access to food resources and the ability to practice and teach culture (; ).
Environmental impacts
Impacts on freshwater and terrestrial ecosystems
Climate change is expected to exacerbate the effects of existing threats and introduce additional pressures to many ecosystems within NSW (; ).
Ecosystems are affected by changing climate conditions. Some species could adapt, for example, some plants may bloom earlier, or some animals disperse to a wider geographic area. However, some Australian species, including those native to NSW, are unable to tolerate changes in temperature or drier conditions (; ). The decline of one species is likely to have flow-on effects on others ().
Listen to a podcast about ways to protect plants from climate change (19 minutes).
By 2085, some freshwater animals in NSW, such as crayfish and frogs, are projected to decline owing to loss of habitat or inability to disperse (). The list includes species that are threatened and critically endangered ().
See the topic for more information.
Impact on marine ecosystems
Ocean acidification
The amount of carbon dioxide absorbed by oceans increases as greenhouse gas emissions from human activities increase.
About 23% of global emissions from 2010 to 2019 have been absorbed by the ocean ‘carbon sink’ (). This absorption alters the chemical composition of seawater, causing the pH of the ocean to become more acidic (). The greater acidity harms marine life.
While marine species can cope with short-term variations in acidity, long-term and permanent changes may reduce the ability of some to adapt. Ocean acidification reduces the availability of minerals used by marine organisms, such as sea urchins, corals and some plankton, to form their shells and exoskeletons ().
Impact on marine life
Increases in ocean temperatures will also affect marine life.
In NSW, certain plant and animal species from tropical and subtropical areas of northern marine environments are likely to move south, if they can, and species in the southern marine environments will migrate into Victoria, Tasmania and even further south. Some marine organisms may run out of available habitat ().
Other impacts of higher ocean temperatures that have been observed in NSW waters are:
- spread of pathogens that affect seaweeds (; )
- decline of temperate kelp forests, which alters the composition and structure of marine ecosystems ()
- spread of invasive species like sea urchins ()
- migration of tropical species, such as certain coral, into temperate areas ()
See the topic for more information.
Climate hazards causing pollution discharge to the environment
If climate risks are not appropriately managed, pollution events that are detrimental to the environment may occur. For example, in March 2022 after a sustained rainfall event, local sewerage treatment plants in the Northern Rivers region were damaged. This event resulted in the discharge of untreated sewage into waterways, posing environmental and health risks.
Water resources impacts
Climate change can strongly affect the water cycle and the availability and quality of water resources ().
Lean more about the natural water cycle.
In Australia, most rainfall evaporates, leaving only 10% as surface water (streams, rivers and lakes) and groundwater. These waters are vital for the survival of ecosystems, people and industries, such as agriculture and tourism.
NSW’s households and industries are highly dependent are highly dependent on surface water and ground water ().
Small changes in rainfall can significantly affect the flow of water into streams and rivers (), affecting the availability of surface water.
Surface water quality could be degraded:
- sea level rise could push saltwater upstream, contaminating freshwater
- extreme rainfall could erode (wash away) soil into rivers, making it harder to treat the water for drinking
- warmer temperatures could increase harmful microorganisms in lakes and dams ().
Adaptation approaches include water conservation measures and using alternative, weather-independent water supplies ().
See the , , and topics for more information on the State's water resources.
Economic impacts
Climate change is already affecting the NSW economy and will continue to do so.
Modelling by NSW Treasury estimates $15.8–17.2 billion (in 2021 dollars) in total economic costs from disasters triggered by extreme weather events on average every year by 2060–61, that is more than threefold increase from $5.1 billion in 2020–21 (). These losses reflect, in part, increases in some events resulting from extreme weather.
Climate change can have complex implications for agriculture. On the one hand, increasing temperature and changed rainfall patterns could limit the growth of certain plants and reduce crop yield (). On the other hand, other plants could adapt or thrive under new climatic conditions ().
See the Responses section for more information about a recent study into these potential impacts.
Increasing ocean temperatures and marine heatwaves could impact the productivity of primary industries, including fisheries and aquacultures ().
Climate change could increase the risk of extreme weather events, such as bushfires and floods (see the topic). This has flow-on effects on the economy, such as:
- increases in insurance premiums, especially in bushfire- or flood-prone areas ()
- damage to critical infrastructure, disrupting travel, electricity and water, telephone and internet services, which can disrupt businesses and delivery of services
- damage to the environment, damage to ecosystems and increased public health risks, resulting in major clean-up and liability costs.
Erosion and property loss impacts
Many sites in NSW are subject to tidal inundation.
Sometimes referred to as ‘sunny day’ or ‘nuisance’ flooding, events include flooding of streets and paths during higher tides. The frequency of these events is variable but has increased over the past few decades (; ; ) as sea levels rise.
Considerable development along the NSW coast is exposed to inundation and erosion hazards. This risk of damage to infrastructure and houses on the coast will increase with climate change. Pollution discharge to coastal areas causing ecological damage could occur if risks are not appropriately managed.
Modelling by NSW Treasury estimates that up to 46,000 properties could be exposed to coastal erosion or inundation by 2060–61 (see the Sea level rise section of this topic for more detail).
Exposure to tidal inundation during king tides currently affects about 600 properties (more than half the site) near estuaries in NSW. This is predicted to increase to:
- 4,300 with 0.5m of sea level rise
- 22,100 with 1m of sea level rise
- 43,300 with 1.5m of sea level rise (; ).
Adaptation to these changes requires further investment in infrastructure, such as raising houses and roads, installing tidal gates to restrict ingress of tidal water into stormwater systems, building levees and sea walls and undertaking beach nourishment.
Some coastal assets will be lost with continued sea level rise.
Responses
Climate change impacts are already felt across NSW.
Climate modelling suggests that even under a global low-emissions scenario, the NSW climate will change. NSW could remain vulnerable to climate-related risks for many decades to come without action now.
This section focuses on climate adaptation. The following is not an exhaustive list because adaptation is a far reaching and complex issue. Other actions to build resilience against extreme climate and weather-related disasters are discussed in the Responses section of the topic.
Actions related to climate mitigation, which are about reducing greenhouse gas emissions, are discussed in the Responses section of the and topics.
The topic provides an update on progress towards the NSW Net Zero Plan.
Find out how ADAPTNSW supports migrant and refugee communities to adapt to climate change.
Climate change adaptation policies, strategies and plans
Climate change legislation
The NSW Government has legislated action on climate change in 2023. The Climate Change (Net Zero Future) Act 2023 sets an adaptation objective to help make NSW more resilient to a changing climate. It also sets greenhouse gas emission reduction targets to help reduce further climate change and establishes an independent body, the Net Zero Commission, to monitor progress towards the act’s goals.
NSW Climate Change Adaptation Strategy
The NSW Climate Change Adaptation Strategy, released in 2022, lays out the NSW Government’s approach to making the state more resilient and adapted to climate change ().
It builds on principles of previous policies and plans, such as the NSW Climate Change Policy Framework of 2016 and Net Zero Plan Stage 1: 2020–2030 of 2020.
The strategy has four high-level priorities:
- Develop robust and trusted metrics and information on climate change risk
- Complete climate change risk and opportunity assessments
- Develop and deliver adaptation action plans
- Embed climate change adaptation in NSW Government decision-making.
The strategy also includes 16 detailed actions to help deliver these priorities.
NSW Climate Change Adaptation Action Plan 2025–29
In accordance with the Climate Change Adaptation Strategy, the NSW Government is committed to publish an NSW adaptation action plan at least every five years.
The NSW Climate Change Adaptation Action Plan 2025–29, released in 2024, is the first plan released under the strategy.
This plan includes 46 actions to target known climate change impacts and risks, help prevent loss and damage, lay the foundation for further adaptation action and help achieve the adaptation objective under the Climate Change (Net Zero Future) Act 2023. The actions help create the knowledge, skills, resources and processes needed to enable further adaptation on a larger scale.
The plan states that decisions on adaption in NSW should be planned and based on comprehensive analysis of the best available information, including Aboriginal knowledge systems. The strategy includes ’Enable Aboriginal adaptation’ as a key criterion in establishing adaptation action plans which will include actions co-designed with Aboriginal communities to promote social, economic and cultural wellbeing.
Reconstruction Authority
The NSW Reconstruction Authority released Australia’s first State Disaster Mitigation Plan in February 2024. This plan helps communities to become safer, more resilient and better prepared for natural disasters including those that are exacerbated by climate change.
Disaster mitigation is discussed in greater detail in the Responses section of the topic.
NSW EPA Climate Change Policy and Action Plan
The NSW Environment Protection Authority (EPA) has a statutory duty to protect the environment of NSW from harm, and this includes harm from the impacts of a changing climate. To fulfil this duty, in January 2023 the EPA released its Climate Change Policy and Action Plan, which outlines key actions it will do over the next three years. These include:
- supporting its regulatory partners, such as the Department of Planning, Housing and Infrastructure and Local Government Areas to understand and consider climate change risks and adaptation when making land use planning decisions
- supporting NSW industry to understand the impacts of climate change on their activities and to reduce their exposure to climate risks in a way that contributes to the State’s goal of making NSW more resilient and adapted to a changing climate
- responding to the environmental impacts of climate change-related incidents, emergencies and disasters, under the State’s emergency management arrangements.
Aboriginal cultural values protection
Combating climate change requires a coordinated, multi-level response from governments, industry and community that addresses both mitigation (reducing greenhouse gas emissions) and adaptation (increasing resilience to climate change impacts). It is essential to include Aboriginal communities in decision-making processes and support Aboriginal communities to access and care for Country.
Increasing numbers of cultural sites and landscapes will be impacted by climate change. This means it is crucial to support Aboriginal communities to lead initiatives that protect cultural values and practices from climate impacts and to develop cultural adaptation pathways.
The NSW Government is delivering adaptation assessment and support for Aboriginal lands and Aboriginal cultural heritage protection.
The Climate Change Adaptation for Aboriginal Cultural Values project aims to embed Aboriginal cultural knowledges in program delivery.
This project supports Aboriginal communities to develop strategies for reducing impacts on cultural practices and values. Each community determines its cultural values in specific locations and identifying key actions and stakeholders.
Climate projections
NSW and Australian Regional Climate Modelling project (NARCliM)
NARCliM2.0 projects future climate outcomes for NSW based on global emissions scenarios.
Available at a fine (4km) scale for south-east Australia and a coarser (20km) scale over Australasia, the updated climate projections are among the most detailed available in the country.
The interactive climate change projections map allows users to search, explore and download specific subsets of the data.
NARCliM projections are regularly updated as new information becomes available and as global climate models are improved.
Modelling impacts of climate change on the NSW economy
The 2021–22 NSW Intergenerational Report is a snapshot of the future to inform future policies ().
The report projects 40 years ahead to 2061 to understand how the State’s population, economy and finances may change on the basis of global and local trends and current policies.
It examines key long-term challenges associated with an ageing population, growing expenditure and rapid transformation in the economy and climate change.
It includes projections for economic outlook to a range of climate scenarios, developed and assessed as plausible by the United Nation’s Intergovernmental Panel on Climate Change.
These projections are consistent with an assumption of moderate warming, with an average global surface temperature increase of 2.0°C by 2060–61 compared with the pre-industrial average.
There is considerable uncertainty in this assumption, because the actual extent of climate change will depend on both the future trajectory of global greenhouse gas emissions and how they affect global and local climate.
The projections considered the economic impact of four key climate risks:
- natural disasters, including bushfires, floods and storms
- sea level rise
- heatwaves
- effects of climate change on agricultural production.
Climate change will affect a wider range of risks, so this discussion should not be considered a comprehensive assessment of the total cost of climate change for NSW.
Protecting critical infrastructure
Climate risk assessment
Climate risk assessments are performed to assess current and future climate-related hazards. This helps to protect public infrastructure and ensure continued delivery of essential services in a changing climate.
The Climate Risk Ready NSW Guide, developed in 2021, supports government agencies in identifying and managing climate-related risks (). It includes a four-step process for managing climate-related risks:
- establish the context
- identify, analyse and evaluate the risks
- treat the risks
- monitor and review.
This guide recommends data sources, such as NARCliM, and provides practical tools and templates to support each step. It assists in incorporating climate change considerations into an agency’s existing risk management frameworks and procedures.
XDI (Cross Dependency Initiative) NSW pilot project
The XDI tool is an online software used for climate risk analysis (). The Department of Planning, Industry and Environment (DPIE) led the XDI NSW project, which ran from 2017–20.
The project aimed to determine climate-related risks to critical infrastructure, including how those risks are interconnected and could affect different sectors. Understanding the interdependencies of critical infrastructure could encourage their owners to work together on adaptation planning (; ).
While the project was able to provide hazard information for water, power, transport and other sectors, more work is needed for this approach to be fully functioning ().
Climate modelling and risk analysis tools must be used with caution, as they involve a degree of uncertainty due to the complex nature of climate change (; ).
Risk assessments cannot predict how various factors, including political, regulatory, technological and behavioural, will influence future outcomes (; ).
Moreover, these tools depend on the accuracy of the data fed into the models, such as satellite imagery, historical insurance records and regional climate models. While these sources are valuable, they cannot capture the full scope of factors influencing risk ().
Managing impacts on primary industries
Climate change poses challenges as well as opportunities for sectors reliant on natural resources, such as agriculture, forestry and fisheries ().
The NSW Department of Primary Industries and Regional Development’s (DPIRD) Climate Change Research Strategy, first published in 2018, provides insights to government, producers and industry of opportunities for timely and appropriate responses to the changing climate, carbon markets and energy opportunities ().
Industry climate change initiatives can focus on both mitigation, such using clean energy alternatives, or sequestering carbon through on-farm projects such as tree planting or soil carbon which can reduce greenhouse gas emissions. They can also address adaptation, such as changing crop varieties, modifying farm management practices or installing infrastructure, such as shade covers to reduce heat impacts. A findings and recommendations report released in 2023 provides project updates and identifies next steps to address challenges ().
The Climate Vulnerability Assessment Project, released in 2024, provides detailed information on how future climate will impact the climate suitability of valuable commodities, including certain fruits, crops and livestock.
Understanding these changes has helped identify vulnerable industries that will need adaptation strategies to remain productive into the future as well as opportunities for growth into regions that have become more suitable ().
Adapting to sea level rise
The NSW Coastal Management Framework helps communities manage coastal hazards, including sea level rise.
The Australian Government and the NSW Government provide policies and guides to consider sea level rise in future developments.
- The Australian Government provides guidance through the CoastAdapt website that provides resources for Australian jurisdictions, adaptation options and Coastal Climate Adaptation Decision Support.
- The NSW State Environmental Planning Policy (Coastal Management) 2018 uses Local Environment Plans to ensure that coastal hazards be considered for vulnerable areas projected to be affected by sea level rise before zoning and development.
- The NSW Coastal management toolkit supports councils to prepare and implement Coastal Management Plans. It provides guidance for engaging with stakeholders and Aboriginal people, as well as information for taking a risk-based approach.
Other adaptations will also be necessary, including raising houses and roads, installing tidal gates to restrict ingress of tidal water into stormwater systems, building levees and sea walls, and undertaking beach nourishment.
Maintaining healthy coastal ecosystems can reduce the impact that sea level rise has on surrounding areas. Actions to support coastal ecosystems include:
- maintaining or expanding coastal buffer zones
- replanting and protecting coastal dunes
- fencing creeks and rivers to keep livestock out
- controlling invasive species
- protecting and restoring mangroves and saltmarsh areas.
See the topic for more information about coastal management.
Sea level rise will also exacerbate the impacts of extreme weather, such as storms, potentially increasing the risk of coastal flooding.
See the topic for more information about risk of flooding.
Future opportunities
Working with Aboriginal peoples
Aboriginal peoples are, and continue to grow as, major landowners and caretakers across NSW.
There is opportunity for Aboriginal communities to play a leading role in climate change mitigation and within new and sustainable economies as part of the transition to renewable energy.
Aboriginal youth are leading climate action through initiatives such as Seed Mob, Australia’s first Indigenous youth-led climate network. They are building a movement for climate justice, with a vision for a just and sustainable future with strong cultures and communities, powered by renewable energy.
There are numerous opportunities to enhance Aboriginal voices in climate decisions, including supporting Aboriginal-led climate change research and respectfully integrating Aboriginal knowledge and scientific data alongside western scientific data ().
Further opportunity lies in continuing to support Aboriginal communities to develop whole-of-Country plans such as the Banbai Whole of Country Plan. This takes a landscape approach to caring for the environment and community.
Research priorities
NARCliM2.0 clearly shows that temperatures will increase, helping inform climate-related risk assessments and adaptation strategies. However, it is less certain on future changes in rainfall.
Further research to understand uncertainties in climate models could provide greater clarity on the magnitude and direction of rainfall changes. The outcomes of this research will be crucial to developing plans and strategies for the State's water supply, agriculture and environmental protection.
Better understanding the effects of climate change on the State's water cycle and its implications for the frequency, duration and intensity of droughts and floods could help reduce impacts on water sources and ecosystems.
Other areas of research could include:
- understanding how climate change exacerbates the risk of natural disasters, such as droughts, floods and bushfires
- finding weather-independent water resources that will reduce the risk of water shortages and build the resilience of communities
- understanding the impacts of climate change on air quality and NSW public health to strengthen the science and drive progress in reducing people’s exposure and vulnerability
- improving our understanding of sea level rise and inundation to support NSW’s coastal hazard management
- piloting and testing the adaptations to ensure that agriculture remains productive under the changing climate providing food security and economic prosperity to regional NSW.
Strategic direction
- Retrofitting old buildings and designing new ones to adapt to increasing temperatures can help save energy, reduce strain on power systems and limit the risks of heat in households.
- Intensifying efforts towards mitigating greenhouse gas emissions and adapting to climate change. Although progress has been made, greater action is required to achieve emission reduction targets and realise good community outcomes.
- Developing a clear strategy to determine NSW’s greatest climate-related risks. A risk-based approach would help focus resources and investment on achieving the best possible outcomes for communities.
- Accelerating adaptation efforts to mitigate known risks, for example, building resilience of bushfire-prone areas to develop communities’ ability to anticipate exacerbation of risks brought by climate change.